
I know from first-hand experience that beginning the quest to understand website metrics can be overwhelming. At first glance, it can seem like you’re just staring at a bunch of numbers and charts with no real meaning. How could you possibly know where to begin?
Engenius has published quite a few resources over the years that unpack the nuances of website analytics. I personally filtered through the educational stack to pull a few sources that will lay the foundation of understanding website metrics on a fundamental level and help you to start analyzing data more effectively.
1. Website Analytics — Defining Key Metrics
First things first, you can’t really understand your site analytics without understanding the language. This blog breaks down some basics to better explain each term and how each metric affects your business. Terms such as session and new user are frequently referenced and will be important for you to recognize. In addition, Bounce Rate, Pages/Session, and Average Session Duration are key to understand how your users interact with your website and which content they find valuable. It’s important to know which digital advertising efforts are working for you. This blog is a must read for your trek into the world of websites.
2. Making Sense of Your Web Analytics
Now that you have a handle on the terminology, we can dive a little deeper. Our next post explores the correlation between key website metrics and analytical data. Who are your users? Where are they coming from? What are they doing on your site? And perhaps more importantly, why do they leave the site? These questions help provide better user insight in order to improve site engagement, remedy negative interactions, and ultimately grow your business.
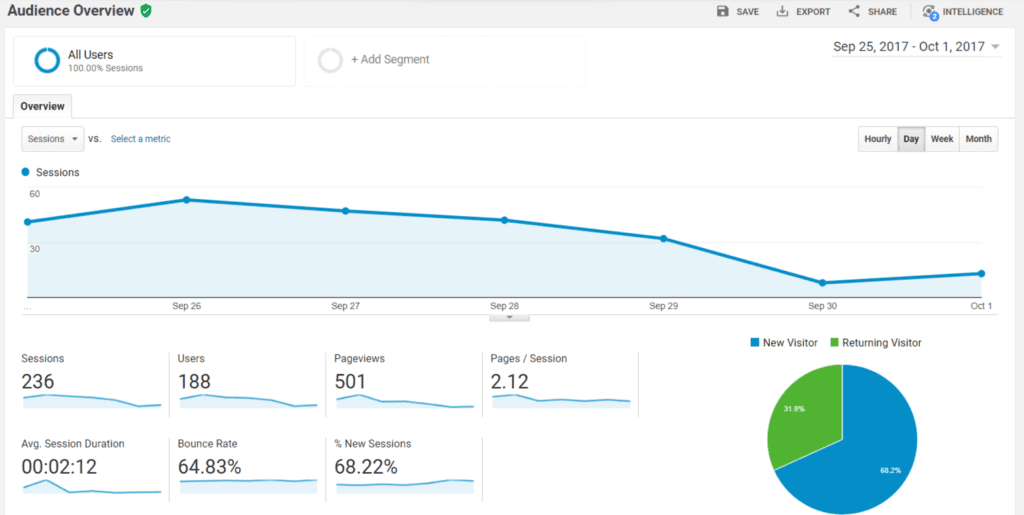
Google Analytics’ Audience Overview tool helps you better analyze your audience’s behavior on your website.
3. Don’t Let Your Website Analytics Deceive You
Even when you can identify who your users are, correctly interpreting data about those users can be tricky. This blog post outlines some common misconceptions about specific website metrics. Above all, it is vital to interpret the numbers and data you gather from your analytics based on context and meaning. Don’t be fooled by numbers alone! Your bounce rates can be in disguise. Time users spend on sites can be misleading, and there are often hidden meanings in your % Entrance and Exit statistics! Learn how to best identify these deceptive details of website analytics and data.
4. Know The Source: Direct, Referral & Organic Website Traffic
Users have varying highways for reaching your website. Understanding what types of traffic are arriving on your site is essential in achieving optimization—and this post can help. Google Analytics tags the three main types of traffic as “Direct”, “Referral”, and “Organic”; each differing in origin and purpose for landing on the site. Consulting a knowledge base on these traffic types will lead to educated maneuvers in your marketing strategy and enhance your business decisions.
5. See How You Compare With Google Analytics Industry Benchmarks
Do you wonder how effectively you are leveraging your website metrics? Our next article can help you find out. Google Analytics Industry Benchmarks are a great tool for gauging the strength of your online presence. You will find this resource offers accurate and specific milestones for measuring industry goals. Google’s Benchmarking tool allows you to narrow your results based on audience, time frame, industry, location, and business size. These specific parameters eliminate the guesswork and provide a clear view of your website’s performance.
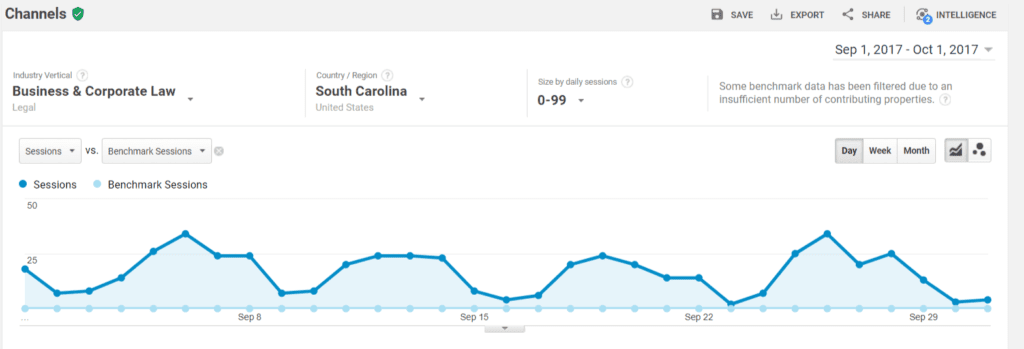
Google’s benchmarking tool allows you to see how your website traffic measures up against other businesses in your industry.
6. Calculate Your Website’s Lead Generation Abilities in Less Than 5 Minutes
Have five minutes? That’s all you will need to calculate how well your website is generating leads. Now take out your calculators and let’s get to work! This blog will help you determine whether your website is performing as well as it could be, as far as attracting your target audience. A few simple calculations will help you generate your “Traffic-to-Lead Rate”. This number should be monitored over time—tracking averages and trends found in the data will provide a better understanding of customers and aid in setting realistic goals for your business.
Each of these resources provides fundamental information and knowledge for anyone seeking to gain a deeper understand of their website metrics. From the most basic terminology to the varying ways to measure and apply data, understanding analytics is crucial to maintain a healthy and thriving website. Pace yourself, and utilize the available knowledge pool to supplement the learning process. And if you’re still stuck? Give us a call! We’d be happy to walk through your analytics with you to determine which web design and digital marketing strategies can benefit your business.

Start the Conversation
Want to take a deeper dive into how to navigate your analytics and improve them?