
You’ve got your ad account set up. Check.
Your campaigns and ad groups set properly. Check.
You’re running multiple ads within each ad group and testing variations of copy. Check.
But, is it all working?
This is the big question. Google gives you hundreds of different metrics to look at. Which ones are most important? Which ones can you ignore? Which ones should you show your boss?
We’re going to break down the most important metrics at each level of company involvement. But first, let’s start with the basics. (Skip ahead if the basics bore you.)
What Is Google Ads?
Google Ads (formerly known as AdWords) is an advertising platform run by (surprise) Google. Google ads operate on a pay-per-click model, meaning advertisers pay Google when users click on their ads. No doubt you’ve seen these ads at the top and bottom (and sometimes beside) your Google search results.
How does Google decide which ads show when and where? Every time you submit a query to Google, in about .8 seconds, Google scans through their massive database of ads and decides which should show on the page. First, using keywords and semantics, Google identifies every single available ad fit to be shown based on the query. Then, an auction takes place. One advertiser might be willing to pay $1.50 for a click, while another is only willing to pay $1.25. In general, the $1.50 bid wins the top slot and $1.25 the next. However, price isn’t the only factor. Google also takes the quality of the ad into account, something we’ll dive into in a bit.
You may have also seen Google Display ads across the web on sites you browse daily. Google Display Ads don’t show up on search results pages, but out in the wild on other websites, often as visual graphics. Around 2 million sites are involved in Google’s Display Network. If you’re anything like us, you spend a lot of your day drooling over display ads about shoes you can’t afford while simply trying to read a blog post or news article.
Not completely sold on Google Ads? Check out our guide to find out which online advertising platform is best for you and read up on our 2021 digital marketing trends to get our thoughts on Google’s monopoly.
Monitoring and Evaluating Google Ads
As a knowledgeable digital marketer, you know you can’t just set up ads and leave them. Well, you can, but only if you want to throw away money. Google ads need to be monitored, evaluated, and optimized. They need to be analyzed regularly.
Most advertisers have varying thoughts on how to properly maintain ads. Some recommend not touching them until they’ve had time to give you adequate data. Others recommend making subtle changes to things like bid, keywords, and ad copy on a regular basis. And some recommend setting up rules and automation so you touch your account as little as possible.
Our team at Engenius prefers a cyclical approach. (That’s right, we do Google Ads as well as building stunning websites. Learn more about our Google Ad service here.) Depending on the size of the ad account, we might adjust bids and keywords weekly, optimize ad copy and landing pages monthly, and perform keyword research / create new ad groups quarterly.
Whether you systematize or utilize automation, ads must be monitored, evaluated, and analyzed on a regular basis. So the million-dollar question, of the hundreds of marketing metrics to look at, which are most important? Which should you be looking at to educate your optimization decisions?
*Most of these metrics are crucial for any pay-per-click campaign – whether social media marketing (like Facebook ads) or search engine marketing.
Which Google Ad Metrics Are Most Important?
-
Return on Advertising Spend (ROAS)
- Cost Per Conversion / Acquisition (CPC / CPA)
-
Conversion Rate
-
Clickthrough Rate (CTR)
-
Cost per Click (CPC)
-
Quality Score
-
Impression Share
C-Suite Metrics
If you’re a business looking to grow, these are your most important metrics. They’re the numbers the C Suite wants to see when you say, “We’re running an ad campaign.” We’re talking returns, ROI, and the bottom line.
Every ad campaign’s goal isn’t to see direct revenue, and not every campaign is targeting bottom-of-funnel keywords. But hopefully, you can assign value to different top-of-funnel actions to gauge performance.
Speaking of C-Suite, here are some great free digital marketing tools to help with reporting and analytics. Still, want help? We’re always happy to talk about what digital marketing could do for your company – let’s schedule a call.
Return on Advertising Spend (ROAS)
Return on advertising spend is just as it sounds: how much money are you getting back? ROAS is the ultimate metric of any ad campaign. When a CEO asks, “How are the ads doing?” – this is your go-to metric.
How to Find it?
ROAS = $ spent on ads / $ received from ads
In order to find a true ROAS number, you need to keep track of your deals and sales and track where these leads came from.
Sounds simple, but there are lots of variables. Perhaps you have a very long buying cycle and gained leads from ads, but they are at the top of the funnel and far from paying you any money. Or perhaps someone’s initial interaction with your site was through ads, but they finally purchased after interacting with a social media post that sent them to your website. Should you attribute that revenue to ads or social website traffic? These are decisions your team has to make.
What’s a Good Benchmark?
Positive is good.
The best benchmark would be to compare your return on ads to the return you see on other channels. If it’s much lower, it either means your account needs some help or it’s not the best channel for you. Alternatively, if you see much higher returns on ads, keep investing!
Cost Per Conversion
Cost per conversion is the amount you’re spending on each desired action taken.
This might just be the most important metric for an individual ad campaign. Of course, a conversion can take many different forms. Perhaps a conversion for you is a purchase, form submission, or email signup. Cost per conversion tells you how much you’re paying for that desired action. When we’re talking about pay-per-click campaigns, this metric is vital.
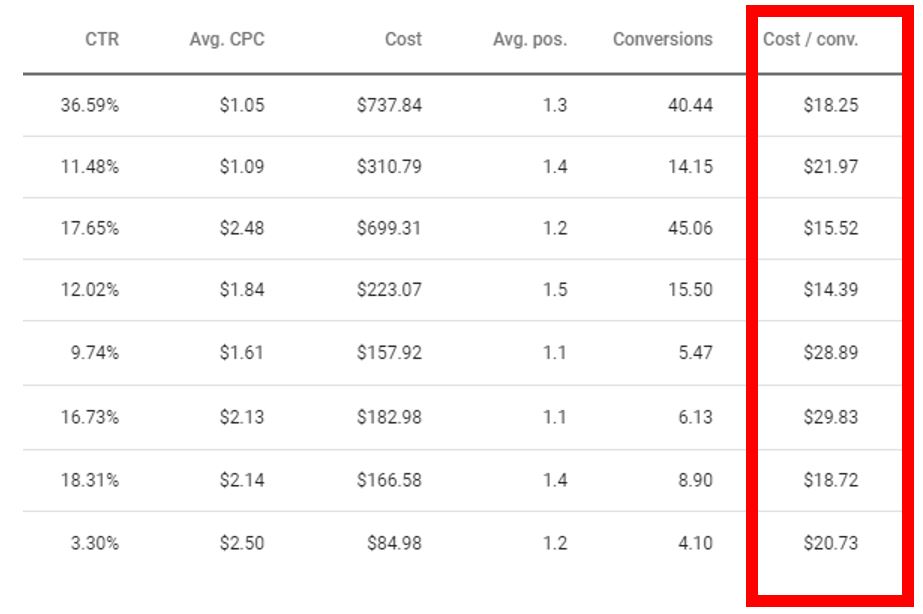
Image from Search Engine Journal
What’s a Good Benchmark?
Don’t buy the general benchmark data you might find from other resources. Every campaign has different conversion goals.
For instance, look at these two scenarios:
- Company A runs Google ads leading users to a landing page where the ask is an email signup. Their cost per conversion is $50.
- Company B runs Google ads taking users to a landing page where the ask is to buy a $500 product. Their cost per conversion is $250.
Company A has a lower cost per conversion, but Company B is probably seeing a $250 ROI on this campaign. A better benchmark may be to compare your cost per conversion in ads to other marketing channels. It may cost $50 to get an email address with ads, but it may cost $1000 to send someone to a trade show where they collect 15.
Marketing Manager Metrics
These aren’t the end-all be-all metrics, but when these are healthy, you should theoretically be seeing good overall returns. Your CEO might not be interested in these, but a middle manager certainly will be.
Conversion Rate
Conversion rate is the rate at which users are taking the desired action post-click.
Conversion rates give you a good insight into your best-performing ad copy, keywords, and landing pages. This metric should tell you a handful of things:
- If your landing pages optimized
- If you’re using the right keywords
- If you’re targeting the right people
Most people jump the gun if conversion rate is low and consider the landing page. But what might actually be happening is poor keywords or targeting. Make sure you’re going after the people and utilizing negative keywords to keep irrelevant clicks from getting through.
One thing conversion rate doesn’t tell you is how qualified the conversion was. Because of this, any successful ad campaign involves open lines of communication between ads managers and sales members.
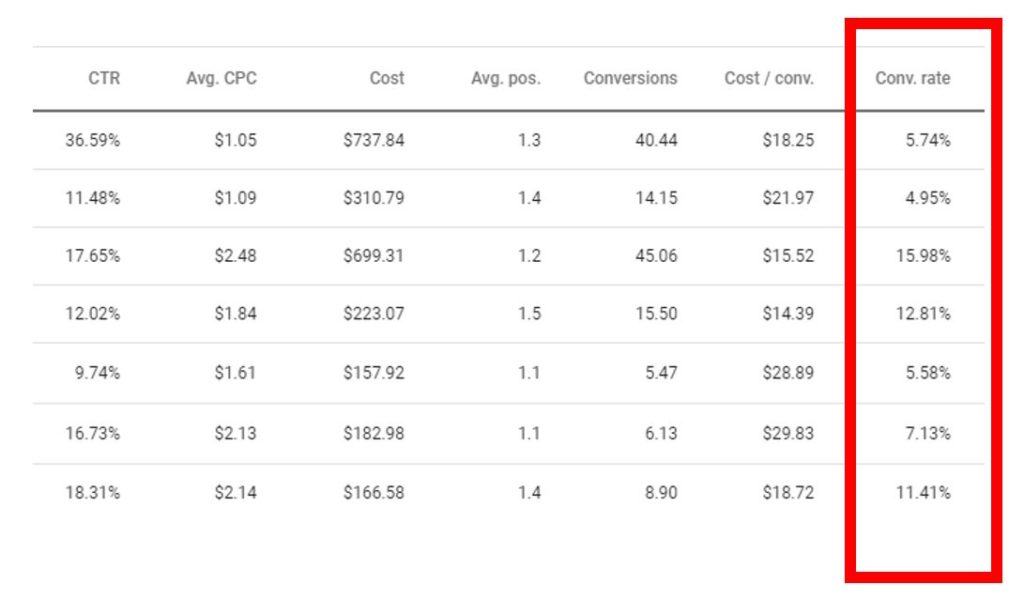
What’s a Good Benchmark?
Conventional thinking says a good conversion rate is between 2% and 5%. However, as mentioned, conversions mean different things to different businesses. A conversion rate on a page asking for an email address will probably be higher than a page asking for a $1,000 donation.
Clickthrough Rate (CTR)
Clickthrough Rate tells you how many people have seen your ad and clicked. It’s an important metric to keep an eye on, but as usual, isn’t so straightforward. You want a high CTR, but when it comes to Google Ads, you only pay for clicks. So if you use language in your ads that weeds out unqualified clicks, you may see a lower CTR. Let’s look at an example:
- Company A runs a campaign seeking to increase shoe sales with direct, straightforward ads. They target “blue shoes with green laces” keywords and have a page optimized for blue shoes with green laces.
- Company B runs a campaign seeking to infiltrate a market with a new product. They target “beef jerky” keywords, but are selling a beef jerky alternative: bacon jerky.
Company A is running a predictable campaign whereas the other is trying to infiltrate a new market and put their ad in front of someone who may not have been necessarily looking for it. So it’s okay if CTR isn’t sky-high. However, if an ad’s CTR gets too low, its quality score could be affected, so you do want to keep eyes on this and make sure your ads are still relevant to the targeted keywords.
Cost Per Click (CPC)
Cost per click is how much you pay per click (pretty self-explanatory). This is an interesting metric though, because many think there’s not much one could do to change this. However, well-optimized campaigns should lead to a declining CPC over time. Over the course of a year, you should hope to see your CPC drop by 10% or so.
What’s a Good Benchmark?
The same resource from Wordstream has average CPC by industry. This is a good benchmark, but again, keep an eye on trends over time.
Execution-Level Metrics
Quality Score
Quality score is an estimate of the quality of your keywords. It runs on a 1-10 scale and is calculated based on ad relevance, CTR, and landing page experience. Quality score can affect where your ad ranks and when / if it shows at all.
You can find an ad’s quality score by adding it as a column within your Google Ads dashboard.
You should always be checking in on quality scores, reworking ad copy, and ensuring a pleasant landing page experience for users.
What’s a Good Benchmark?
Having a quality score between 7-10 should be your goal. Below 7, and your ads may not be showing!
Impression Share (IS)
Impression share tells you how often your ads are showing compared to how often they could have been shown. If your ad isn’t showing, it’s due to rank (Google is prioritizing ads it thinks searchers will be more likely to click) or budget (yours is limited). You want your ad to show in every possible situation.
Impression share is really helpful to know, but what might be even more helpful is to know why an ad didn’t show. If due to rank, you need to address that ASAP. If due to budget, this means there’s opportunity.
You can find Impression Share, Lost Impression Share Due to Budget, and Lost Impression Share Due to Rank by adding them to columns for view within the Google Ads dashboard.
What’s a Good Benchmark?
If your impression share is lower than 70-80%, you should look to where you’re losing out. If due to budget, there’s not much of a benchmark. Sometimes our resources are just limited. A Lost Impression Share Due to Rank of 20-30% is pretty high and needs to be addressed. If you want a better impression share, but don’t want to pay for it, you can make SEO and Google Ads work together for you.
Now go track those metrics and only report the good ones to your boss! (Just kidding.)

Start the Conversation
Ready to get more out of Google? We can help. Let’s talk Google Ads.