
Google Analytics is an incredibly powerful tool that offers easily accessible insights from the moment you open the interface, but a lot of information can be missed if you don’t pay attention. From determining which marketing channels are garnering you the most new leads to analyzing the path a user takes from initial interaction to final purchase, there’s a lot to be gained by sifting through the data that Analytics continuously collects.
Google offers numerous certification courses to help individuals learn how to make the most of their services; however, even as someone who is equipped with this knowledge, I regularly discover new ways to leverage the power of Analytics.
One such example:
The industry benchmarks comparison tool.
Industry Benchmarks? Whatever do you Mean?
Whenever we start working with a new client — particularly one that is running ads for the purpose of increasing website traffic — we push them to set measurable goals so that we can provide sound recommendations when it comes to budget and strategy.
But here’s the kicker:
Most small business owners don’t know what constitutes a reasonable goal when it comes to site traffic. Even if they know how much traffic their site currently gets, they don’t know if that number is good or bad. As a result, they struggle to set a reasonable budget that will help them reach their business goals.
Luckily, Google Analytics offers an easy-to-use industry benchmarks tool which allows you to compare your current site traffic to other web properties in similar industries. Follow along for instructions on how to access and take advantage of this easily overlooked function.
Step 1: Access the Benchmarking Tool
If you regularly delve into your Google Analytics, you may have glanced over the benchmarking tool without realizing it. I certainly did.
From your dashboard, look to the menu on the left and click on the Audience tab. From there, look to the bottom of the list. Right above Users Flow you should see the Benchmarking option.
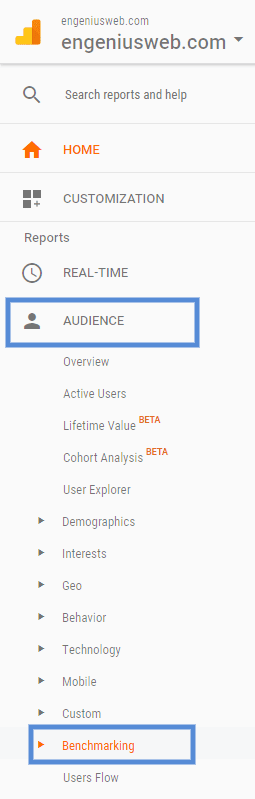
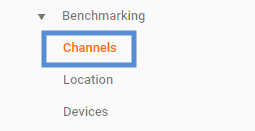
Under Benchmarking you’ll see three more options: Channels, Location and Devices. For the purposes of this post, we’ll be covering Channels.
Step 2: Choose Your Time Frame
Anytime you’re looking into Google Analytics you should choose a specific time frame, since the context of that period likely had an effect on your site traffic. Maybe you work for a heating and air business that is particularly busy in the middle of summer. Or perhaps you always get a lot of business at the end of the year around Christmas.
Either way, you want to be purposeful when choosing a time frame. We usually look at our data in wide swaths — months or years at a time — but you can even look at weeks or specific days. If you want to see how a big week-long sale affected your site traffic, that’s something you can dig into.
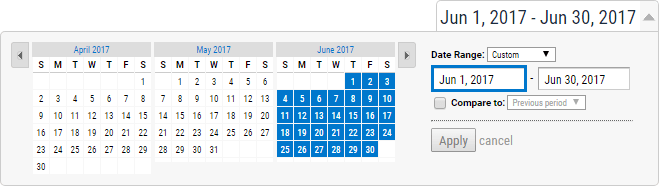
To adjust the time range you’re looking at, go to the top right of the Google Analytics interface and click the dropdown menu with the date range in it.
Then, choose the time period you want to analyze.
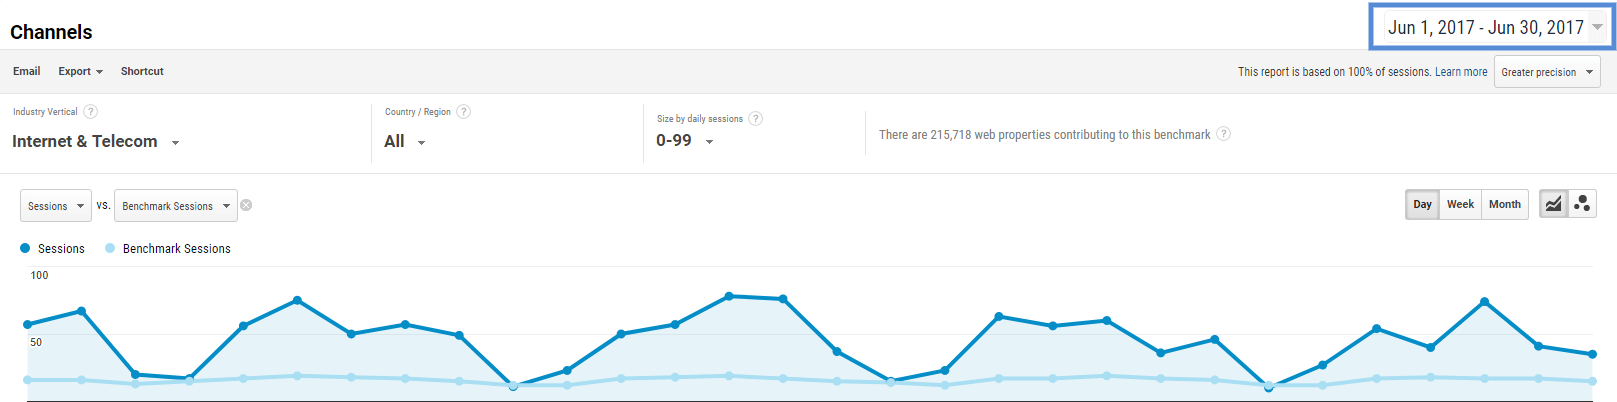
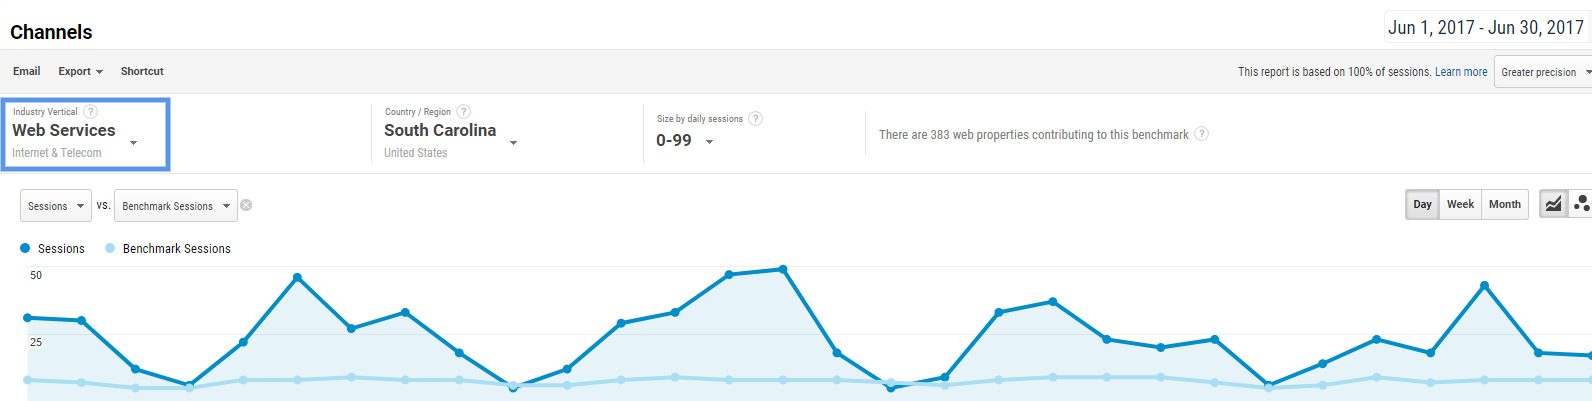
Step 3: Choose Your Industry, Location, and Business Size
This is my favorite part of the industry benchmarks tool because it allows you to be as specific or broad as you want.
In order for Google to find web properties to compare you to, you have to help out a bit. Start by choosing the industry vertical you fit within. You can go as broad as Law & Government, or dial down to something more specific like Labor & Employment Law. Choose whatever you think best describes you.
Since we offer a wide range of digital marketing services at Engenius, I would choose something that is specific but not too narrow, like All Web Services. It all depends on what you offer.
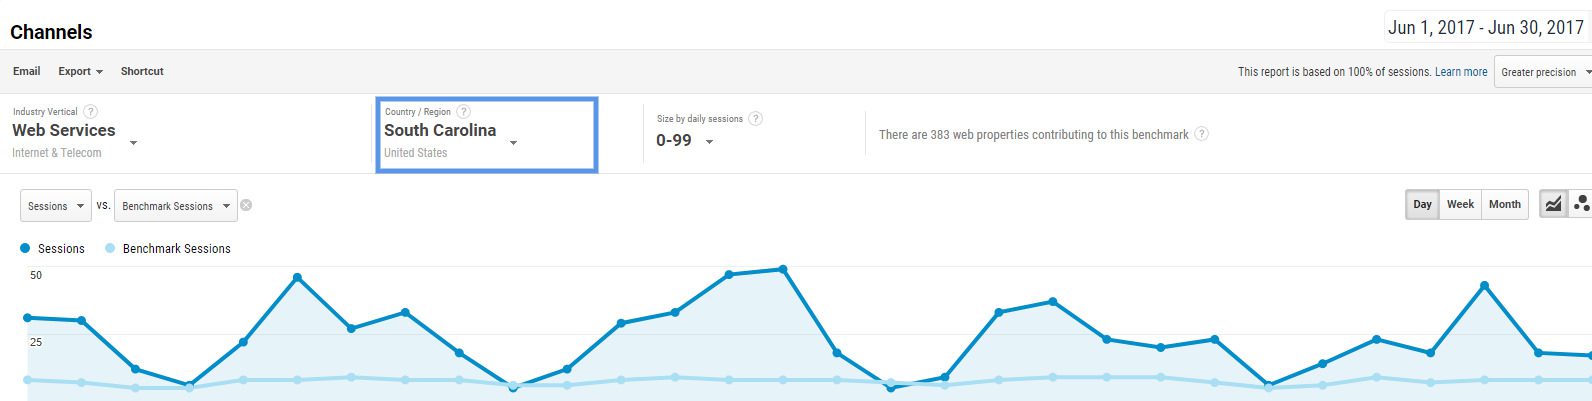
Next, choose the location you want to compare yourself to. This will likely be in the United States, but you may want to look at individual states and not the entire country, depending on where you offer your products and services. At Engenius, we’d focus on South Carolina since that’s where we primarily conduct business.
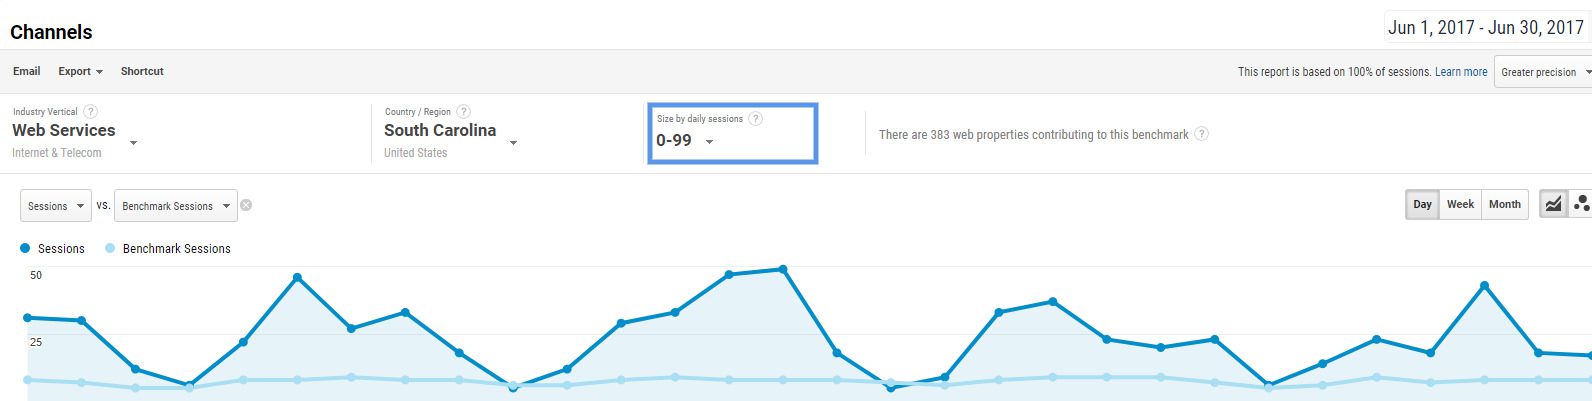
Finally, choose your company size. This isn’t so straightforward, because Google equates your company size to the average number of daily sessions your website garners.
To get an idea of what number best fits you, look at your sessions over the course of a year and divide that number by 365 to determine your average daily sessions.
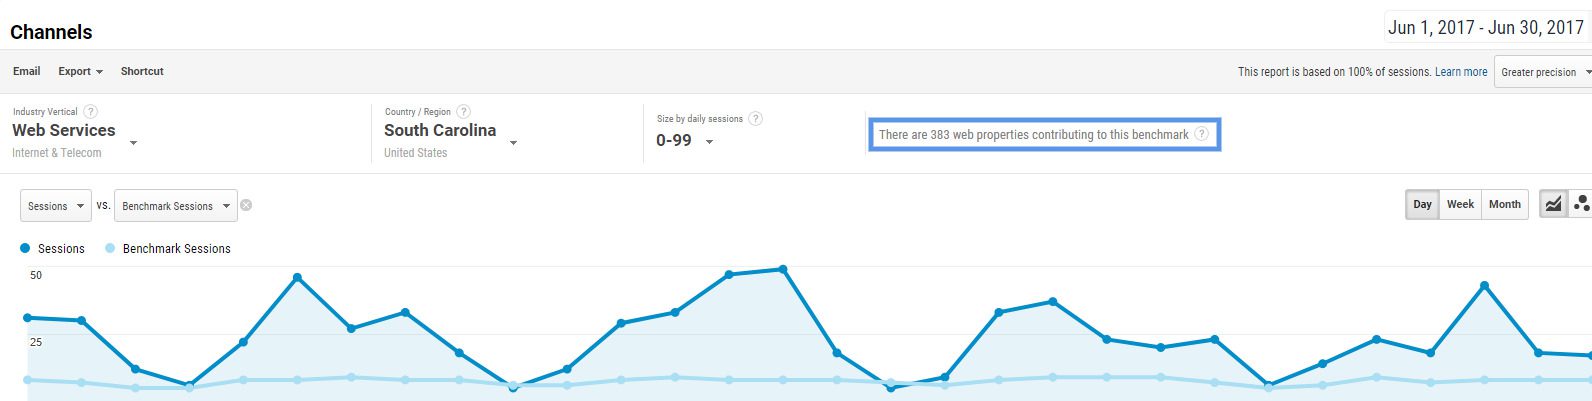
Something to keep in mind:
The more you narrow your comparison by industry, location and business size, the smaller the sample size will be. While the information will likely still be statistically significant, this is important to keep in mind. Just by focusing on web service companies within South Carolina that receive 0-99 sessions a day, our sample size dropped from hundreds of thousands to just below 400.
Step 4: See How You Compare!
Once you’re satisfied with the parameters you’ve set, it’s time to finally see how you compare. The line graph at the top of the page will give you an idea of how your total site traffic compares, while the table below will show you how specific channels of traffic compare.
I find the table particularly helpful because it gives me an idea of how our different marketing methods are working, from organic ranking efforts and paid advertising to blogging and email marketing.
Equip Yourself With The Right Knowledge
The Google Analytics industry benchmarks tool is a valuable asset, but in the end the information it provides is only valuable if you know how to use it. Sure, it’s fun to see how you compare to law firms in Bangladesh, but that’s not going to help you much in the way of improving your lead acquisition efforts.
At Engenius, we work with clients from a wide range of industries to create measurable marketing strategies focused on reaching specific business goals. If you want to learn more about what we can do for you, or if you just have some questions that you’re itching to have answered, please reach out! We love learning about the passions of business owners and sharing that excitement with others.

Start the Conversation
Interested in learning more about your Google Analytics and how to better them?