

Earlier this month, we released a blog post that defined key metrics in Google Analytics. In case you missed it, or had a little bit too much eggnog over the holidays, here’s a recap:
- Sessions: Total number of Sessions within the date range. A session is the period time a user is actively engaged with your website, app, etc. All usage data (Screen Views, Events, Ecommerce, etc.) is associated with a session.
- % New Sessions: An estimate of the percentage of first time visits.
- New Users: The number of first-time users during the selected date range.
- Bounce Rate: The percentage of single-page visits (i.e. visits in which the person left your site from the entrance page without interacting with the page).
- Pages/Session: The average number of pages viewed during a session. Repeated views of a single page are counted.
- Avg. Session Duration: The average length of a Session.
Now that you know what these terms mean, I want to help you understand what they mean in relation to your website’s analytical data. You don’t have to be Google Analytics certified (yes, that’s a thing) to understand how you can turn insights into action. Here are some easy ways you can improve user engagement, grow your website, and drive business!
1. Find out who your users are
One important feature of Google Analytics that many people don’t know about is the demographics section. Have you ever wondered how old your visitors are? Are they male/female? What interests your users have? You can find out all of these things in Google Analytics.
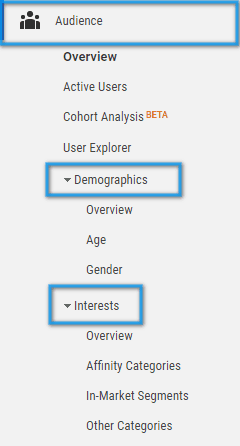
From the dashboard, navigate to Audience, then Demographics. This will give you an overview of ages and gender. Right below Demographics, you will see Interests in the sidebar, where you can gain insight in what your users like to learn about. How does Google know these things? We don’t ask such questions!
2. Find out where your users are coming from
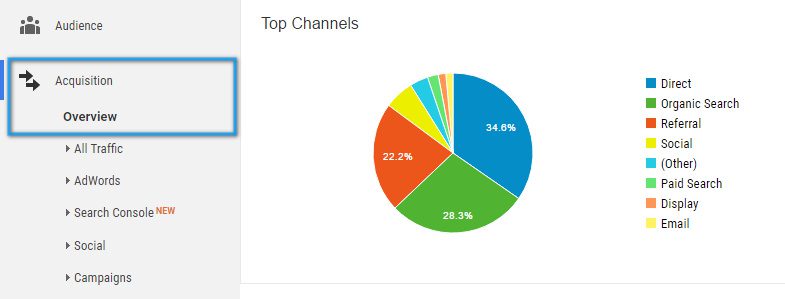
The first section of Google Analytics I typically look at is Acquisition, which gives you an overview of how people got to your website. When you open up the Acquisition overview in analytics, you are presented with a pie graph and a table split up into multiple categories, in what Google refers to as channels. These are the sources of where your visitors come from. The most common channels are Direct, Referral, and Organic, but there are others too. We don’t have time to cover what these channels mean here, but we wrote a good post you can refer to.
If the majority of your visitors are coming from direct traffic and very little organic, that could mean you aren’t doing enough search engine optimization (SEO) and your users aren’t finding your website on Google.
To go a level deeper, what search terms are your users using to find your website? This gives you insight into what they are looking for, and you can optimize your site’s content accordingly. You can also look at what websites your users came from (referral traffic), and what social media outlets your users are coming from.
3. Find out what your users are doing
Once you know how your users got to your site, the next thing to learn is what they do once they get there. Key metrics are: Bounce Rate, Pages/Session, and Average Session Duration.
To get insight from a content perspective, I like looking at the Behavior section, which will give you an overview on some of your most popular pages. Where are most of your visitors spending their time? How long did they spend there? Knowing these things will help you learn what content your users like, and what they are looking for.
4. Find out why your users are leaving
The metric that tells you the most about why your users leave your site is bounce rate, the percentage of single-page sessions. Higher bounce rates mean more single-page sessions. There are many reasons for high bounce rates. Your visitors could find the information they need right away on the first page. Or maybe they aren’t finding the information they are looking for, and they could be leaving for that reason.
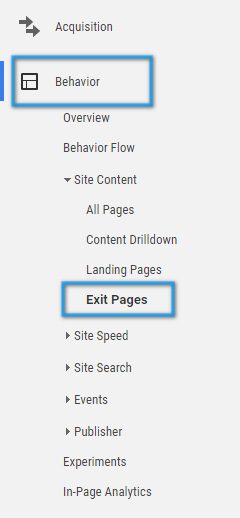
Google Analytics also lets you see the pages from which your visitors most frequently leave your website. Google calls these exit pages. The more exits a page has, the higher its exit rate. Knowing this information can be critical for understanding your users’ journeys, like how they register an account or make a purchase.
Conclusion
One of the primary benefits of marketing online is that you’re able to accurately measure the performance of your work. Unfortunately, many people struggle to understand the metrics that Google reports, or they simply don’t know the full capabilities of the tools at their disposal. As a result, the contribution a website has on business performance can be easily overlooked.
Don’t let your web analytics confound you. You have the power to take these numbers and attribute real meaning to them, creating actionable data that can lead to changes that improve your bottom line. It’s not easy, but it’s well worth it.

Start the Conversation
Interested in understanding more about how to improve your web analytics?