
I’ll be the first to admit I’m a data nerd, so one part of my job I ABSOLUTELY love is analyzing and organizing Engenius reporting and client website analytics. The internet is a treasure trove of data, but without understanding all of the numbers, their definitions, and how they can impact your business, having access to the treasure doesn’t do you much good.
I could write pages and pages of information regarding website analytics and data, but in this post I’m going to stick to the basics.
Session:
When someone comes and visits your website, that is called a session. A session is the period of time in which a user is actively engaged with your website, app, etc. All usage data (Screen Views, Events, Ecommerce, etc.) is associated with a session. If your website analytics say that within the last 30 days your website has had 837 sessions, then 837 devices visited your website.
Your sessions are not a unique number, however, so if I visit a website 5 times within 1 week, it will add 5 sessions to the total, even though I’m only one person.
% New Sessions:
This number tells us the estimated percentage of total sessions that are first time visits to your website. This particular number can be confusing because Google Analytics defines a new session as a first time visit. Not as in I visited the website Wednesday and then started a “new” session the following Friday — that would technically be two sessions. Only the first session will count toward the percentage of new sessions. If 66% of our 837 sessions were new, then an estimated 552 sessions were first time sessions.
New Users:
This represents the number of users who visited your website for the first time during a selected time period. At first glance, this can seem like a pretty cut and dry definition, but in reality it’s a bit more complicated. When you visit a website, a cookie is created and tied to your device and/or browser, which places you in this New User category. When you return to the website, Google Analytics identifies the cookie on your device/browser and counts you as a returning visitor. However, if you’re viewing the website from a different browser or device, or if you’ve cleared your cookies since your last visit, you’re identified as a new user all over again.
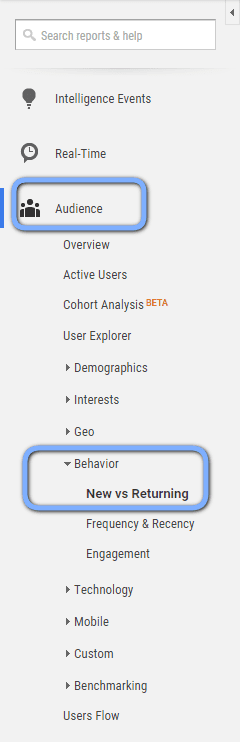
At this time the most accurate way to see new vs. returning metrics within your Google Analytics is to go to Audience > Behavior > New vs. Returning. However, keep in mind this information is based on cookies, so there are some slight discrepancies.
Bounce Rate:
When I first began digging into website analytics, I universally viewed high bounce rates as negative and low bounce rates as positive. As my analytics knowledge deepened, I learned that this approach was too simplistic, taking for granted the complexities and goals of different websites.
The common understanding of a website “bounce” is that someone comes to your site, doesn’t find what they’re looking for, and then “bounces” off (leaves the site, exits their browser, etc). By Google’s definition, a bounce is any web visit where the visitor doesn’t interact with the website (ie: visit other pages besides the one they landed on, click on internal links, etc). Therefore, your bounce rate is the total percentage of visitors who only visit one page and don’t interact with anything else on the site during a given time period.

Now let’s say I visit a restaurant’s website, and both the reservation phone number and daily specials are right on the homepage. I decide I will eat dinner there, dial the phone number, and make my reservation. Then I close my web browser. Because I never clicked beyond the first page, this web visit would be classified by Google Analytics as a bounce.
By this logic, you shouldn’t assume that a 70-80% bounce rate means that no one is finding your site helpful. In the same vein, if you have a 30% bounce rate it’s possible that people are having to click through multiple pages to find what they’re looking for, or they can’t find it at all! That being said, it is best to use your bounce rate alongside other metrics to get a more accurate picture of whether or not yours is concerning.
Pages per Session (or Pages / Session):
Provides insight into how many pages users are accessing when interacting with your website. It’s important to note that pages/session are not unique. So if the same page is visited multiple times within one session, each visit adds to that overall pages/session number.
Similar to bounce rate, if a user is visiting lots of pages, they could be engaged and find your content valuable. On the other hand, they could find your site disorganized and cluttered, forcing them to click around aimlessly in the hopes of finding what they’re looking for (before potentially going to your competitors more organized website).
In combination with other metrics (such as bounce rate and session duration) you can use these numbers to get a clearer picture of what pages are best for calls to action, newsletter sign up forms, and other user engagement tools.
Average Session Duration:

It’s imperative to remember that the first word of this metric is “Average”. As we’ve learned with some of the other metrics we’ve discussed, context is everything. Do you have an ecommerce website where people complete online purchases? Then you probably want to see a higher session duration, since this indicates people spend time browsing your products. Are you a physician that wants your office location and appointment hours quickly identified? In this case, a four minute average session duration could mean that your content isn’t as obvious or easy to find as you think.
Website analytics can be incredibly helpful, but you can’t look at these numbers in a vacuum. You have to remember the context of the metric and how it ties in with other performance indicators. It’s easy to interpret the numbers as you want to see them, justifying your assumptions without comparing them against other metrics, but you have to take into account these numbers, the specifics of your industry, and the needs of your users. That’s the difference between using data for illumination and using it to support your own preconceived notions.

Start the Conversation
Interested in learning more about website analytics and how to improve yours?